Final Report
This is Group 53's final report for our CS 4641 Project, which predicts movie revenue based on past trends. You will find our literature and evaluations of our models, including what we created and the results we achieved.
View on GitHubIntroduction and Background
The movie industry is challenging to navigate, and predicting the success of one’s film can be the difference between making it big or losing millions of dollars. Traditionally, measurements like “star power” and marketing campaigns were used, but they often weren’t reliable. With the rise of digital platforms like YouTube, new data sources have emerged, offering deeper insights into audience engagement and movie success metrics. This project will explore machine learning and its applications to predict movie success using traditional metadata and data found online.
Literature Review
Research has been done to explore different aspects of predicting the success of a movie. Some researchers used sentiment analysis and data mining techniques to predict box office revenue based on the cast, budget, and genre [1]. Other studies have investigated the impact of social media on movie popularity [2]. Recent work shows how transmedial data such as YouTube trailer views can enhance the accuracy of predictions [3]. There is still a gap in research that comprehensively combines traditional metadata and transmedial data for recent films.
Dataset Description and Link
This project uses the “The Movies Dataset” from Kaggle [4], which contains movie metadata including genre, budget, revenue, and release date. We will seek to incorporate features like YouTube trailer view counts and social media sentiment analysis, time permitting. We will concentrate on movies released up until July 2017 due to the recency of the dataset.
Access the dataset here.
Problem Definition
Studios and distributors require accurate predictions to guide decisions on marketing, distribution, and investment. Current methods often lack the precision needed in today’s evolving media landscape. This project will address this issue using machine learning techniques.
Motivation
Accurate movie predictions offer significant benefits. Studios can optimize budgets, distributors can refine release schedules, and investors can assess project viability. Additionally, understanding what drives success offers valuable insights into audience trends and preferences.
Methods
Data Preprocessing Methods
-
Data Cleaning
Data cleaning was the core of our preprocessing operations, as we identified and removed any missing, duplicate, or irrelevant data. This was crucial because the Kaggle dataset that we used initially had over a dozen features, many of which would not help in predicting revenue. For example, the poster image links included in the original dataset were completely useless for our purposes. If “poster type” (minimalist, floating heads, etc.) was a feature, certain trends could potentially be identified, but simply including images of posters would do nothing. So, our first step was to set a completed list of features. We decided on using “budget”, “revenue”, “vote_average”, “popularity”, “genre”, and “production_companies”. We also converted all numerical features to floats with the .astype(float) function. This ensured that any important information was not lost and that comparisons and operations between features could be conducted smoothly. Lastly, all placeholder values were removed from the input data with the following code:
df = df[(df['budget'] > 0) & (df['revenue'] > 0)]This ensured that only data points with a recorded budget and revenue were considered as inputs.
-
Feature Engineering
Feature engineering helped enhance our model’s performance, primarily by transforming raw data into something more suitable. For example, all data points that had a value of 0 for “popularity” were replaced with the mean popularity of all data points. This was implemented using the following code:
df['popularity']=df.mask(df['popularity']==0, df[df['popularity'] > 0]['popularity'].mean())['popularity']This was done because 0 was not a representative value of the data as a whole and too many zeros would skew the results. Such data points were not removed because all their other features contained valid values which indicated that these points could be used as inputs but without being classified as outliers.
(In code, SciKit Transformers were used after One-Hot Encoding). -
One-Hot Encoding
We used both one-hot and ordinal encoding in our model. This was because, for some features, an ordering had to be implicitly defined, and for others, they just had to be represented as unique discrete values. For example, one of our features was “genre”, so categories like horror, comedy, action, etc. do not have an implicit order defined between them. Thus, we used one-hot encoding for genres. This was done through the following commands:
genre_names = [[genre["name"] for genre in json.loads(str(genre_list).replace("'", "\"")) if "name" in genre_list] for genre_list in genres_data]
mlb_genre = MultiLabelBinarizer()
one_hot_encoded_genres = mlb_genre.fit_transform(genre_names)
# replace genres in dataset with one-hot encoded
df= df.drop('genres',axis=1).join(pd.DataFrame(one_hot_encoded_genres)).fillna(0)
The first line of code traverses the “genre” column to individually capture each genre that is defined within the dataset. Then, we create an instance of a MultiLabelBinarizer object that mimics the principle of One-Hot Encoding while allowing a movie to be classified under multiple genres. The last two lines convert each data point’s genres into an array that contains binary values. Data points that do not have any associated genres are assigned a 0, in line with standard data cleaning practices.
Machine Learning Algorithms
-
Linear Regression
The linear regression model implemented for this project was designed to predict movie revenue based on several key features, including budget, popularity, TMDb vote count, release year, and genre categories. The model utilized log-transformed versions of budget (log_budget) and popularity (log_popularity) to address the right-skewness present in the data and to improve linearity in the relationships. It analyzed continuous variables like budget and popularity as well as categorical genre variables, which were represented through One-Hot encoding. Visualizing this model's choice in regression coefficients revealed patterns in how these factors influence revenue predictions, as demonstrated in the following generated model:
If the following embed does not show an image, please click here.

-
Random Forest
The random forest model implemented for this project was designed to capture the complex, non-linear relationships between movie revenue and predictive features. Unlike linear regression, this method leverages multiple decision trees to model feature interactions. This effectively handles continuous variables like budget and categorical variables like genre one-hot encodings without requiring manual transformation. Through aggregations across multiple decision trees, the model reduces variance while maintaining interpretability through feature importance scores. These scores reveal which factors, such as budget or specific genres, have the strongest influence on revenue predictions. The model's randomness inherently helps to reduce overfitting for this dataset.
-
Neural Network
The neural network model is a more sophisticated attempt at revenue prediction, using multiple layers with ReLU activation functions to learn data patterns. The architecture we designed processes normalized continuous features like budget and runtime alongside embedded categorical variables like language and genres. Dropout layers and L2 norm regularization were incorporated to stabilize generalization. The neural network is better than the random forest at capturing the more subtle, high-order interactions between features, including how budget and genre feature combinations can non-linearly impact revenue. Though its accuracy is less interpretable than tree-based methods, its performance was evaluated through loss curves and mean absolute error metrics in log-space, demonstrating an impressive predictive power for film revenues. However, extreme outliers remain an issue.
Learning Methods
Since our midterm report, we have expanded our approach by implementing three distinct supervised learning methods: linear regression, random forest, and a neural network. Each model we have implemented offers unique advantages and disadvantages in predicting movie revenue based on features like budget, runtime, genre, and language.
Our linear regression served as a baseline, revealing key linear relationships but struggling with the inherent non-linearity and high variance in movie revenues seen with most of the features. To address this, we developed a random forest model, which better captured these feature interactions through an ensemble of decision trees, improving prediction accuracy for mid-range films while remaining interpretable. Finally, our neural network leveraged deep learning to model complex, hierarchical patterns in the data, using dense layers to better balance performance and generalization.
To provide a comprehensive view, the models do the following: linear regression for interpretable linear trends, random forest for stable non-linear modeling, and the neural network for capturing intricate feature inter-dependencies. The accuracy of these models is quite good, but there is still a lot of room to improve.
Results and Discussion
4.1: Visualizations
-
Linear Regression
If the following embed does not show an image, please click here.

To better understand our model’s behavior, we visualized the actual versus predicted revenue with a scatter plot, which proved to be very informative. In an ideal model, the prediction would always equal the true value, so points would align tightly along the red diagonal line. With an R2 value of ~0.6, our scatter plot demonstrates a broadly linear correlation, indicating that, as the predicted success of a movie increased, so too did the actual revenue. We noticed deviations at the high end of this scale, as blockbuster movies with large actual revenues consistently outperformed our predictions, indicating an underestimation for those films. This suggests that our linear model did not fully capture the unique factors that gave top films their incredible success. Our predictions for films in the middle revenue range proved to be reasonably accurate, and we examined the distribution of residuals to confirm our findings. The residuals were roughly centered around zero but showed a slight right skew, since our model tended to severely underestimate revenue for high-grossing movies, leading to large positive errors where actual revenue exceeded predictions. Aside from the outliers, there was no strong bias across most of the range; residuals for mid-level movie performances were relatively symmetric in their distribution. Our visualization of the data aligns with our quantitative metrics. The linear model performs well for the bulk of movies, but it currently consistently underestimates top performers and overestimates a few of the lower performers. In our case, improvements are needed in capturing extreme cases of movie success, potentially with the addition of new features like YouTube trailer views.
-
Random Forest
If the following embed does not show an image, please click here.

To better fit the nonlinear aspect of the problem at hand, characterized by the crescent shape in our linear regression model's prediction graph above, we decided on an alternative approach with a random forest model. Upon first glance, it is clear that the random forest model performs better than linear regression at the upper end of the curve. However, it is important to note that the model consistently overestimates revenues that are less than a million, similar to what we saw with linear regression. One potential cause of this overestimation is that the dataset could have more accurate information (such as popularity) for more successful movies. It could also be a result of our approach to replacing missing values in the dataset.
-
Neural Network
If the following embed does not show an image, please click here.
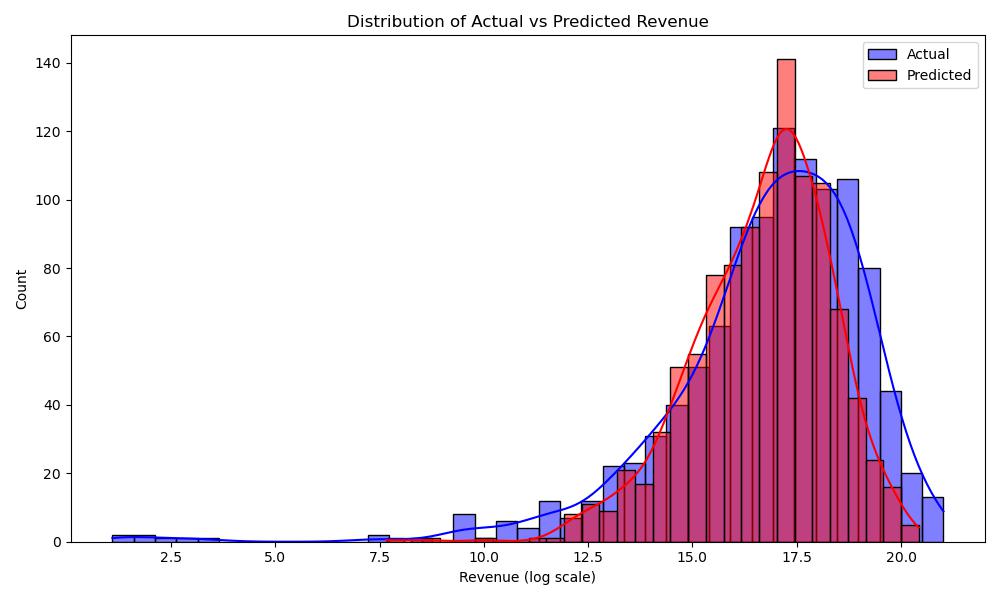
The above visual shows the actual revenue distribution vs the predicted revenue distribution from the neural network model. The model can predict the revenue of movies in the middle range fairly well, but it tends to underestimate the revenue of movies whose true revenues are significantly farther from the mean value. This means on average, it should give better predictions for films that are more typical of "the average movie" in the dataset.
4.2: Quantitative Metrics
The linear regression model yielded moderately accurate results in predicting movie success. For instance, on the held-out test set, the model achieved an R² value of ~0.60, meaning it explains about 60% of the variance in movie revenue/ROI. This indicates that the model is capturing a significant portion of the trend, though roughly 40% of variability remains unexplained. The Mean Squared Error (MSE) was approximately 1016 in squared dollar units for all revenue predictions, while the Mean Absolute Error (MAE) indicated that the average prediction deviated by a hundred million dollars. An R² in the ~0.5–0.6 range is generally considered a moderate goodness-of-fit. The model is certainly better than a naive guess, but may not be precise enough for high-stakes decisions. The Explained Variance Score was approximately 0.60, closely reflecting the R² value, as there was no significant bias offset in the predictions. These metrics suggest that our linear model has some predictive power, but there is adequate room for improvement. In essence, our model reasonably estimates a movie’s success, but individual predictions can deviate significantly from actual outcomes.
The random forest model presented a solid improvement in its metrics relative to the linear regression model. Namely, the R² increased by 10% from its linear regression value. The average error for a given movie prediction decreased from 100 million to 37 million with this approach. The random forest model thus performs better than the linear regression model, as anticipated.
The neural network did not present as impressive of results as we had anticipated given the balanced, tight nature of the predicted/actual visualization above. With an R² of approximately .51, the neural network fails to account for a large amount of the variance in the revenue. With a mean average error of $51,471,000, the average movie’s revenue is predicted with a moderately large error.
4.3: Model Analysis
-
Linear Regression Model
Our linear regression model’s moderate performance is explained by the inherent simplification caused by the nature of linear regression. Since it can only model straight-line relationships, non-linear patterns in the data resulted in an underfit. This was confirmed by our R² value of approximately 0.6, indicating high bias but no overfitting. This is logical, as real-world factors that influence the success of a movie are not purely linear. Social media buzz and virality can both have a huge impact, which violates the linear assumption we initially made. Likewise, interactions between features, such as a high marketing spend combined with a holiday release date, might yield an outsized impact, and this is not accounted for in a simple linear model. Our feature set was also quite limited, as important predictors like cast fame, director track record, or social media hype were absent; the model only drew insight from a slice of the whole picture. As a result, the linear regression worked reasonably well in areas where the relationship between inputs and output was roughly linear and covered by the given features, but it struggled with edge cases. In particular, movies that turned out to be runaway hits or massive flops were not predicted accurately. The model tended to under-predict the revenue of top blockbuster films and over-predict very low-performing films because those outcomes were driven by factors beyond the scope of our linear features. This aligns with the nature of our data – movie revenues have very high variance, where the majority of films earn modest amounts but a few earn hundreds of times more. A single linear trend line does not seem to be able to properly account for outliers, resulting in significant errors for those cases. The general direction of factors affecting revenue was captured, but nuances and complex combinations were not adequately captured, which led to an underfitting in terms of the model’s performance.
If the following embed does not show an image, please click here.

The above model captures the features of the linear regression ranked by their contribution to the prediction of revenue. All coefficients are shown as absolute values. The bar graph suggests that financial investment (budget) and audience appeal (popularity) are the primary drivers of movie revenue, followed by genre and release year as secondary factors.
-
Random Forest Model
Our random forest model outperformed the other two models because it overcomes some of the pitfalls of linear regression and neural networks. First, random forests tend to work well on smaller datasets like our filtered movie dataset because of their bagging method for aggregation. Although this dataset was large when we sourced it, there are way less rows with both budget and revenue information. On the other hand, a neural network requires more data to prevent overfitting, especially on a regression problem with this much variance in the target. Also, the random forest may have been suitable for this dataset because the decision trees split on a threshold, eliminating the need for feature scaling. This also makes the random forest less susceptible to outliers because the decision for a given branch conditioned on a continuous feature happens on a hard split, based on the value of that feature. Also, the randomness involved in bagging helps to cancel out some noise like the variance in revenue.
-
Neural Network Model
Our neural network model addresses many of the limitations seen in linear regression by effectively capturing the non-linear relationships inherent in movie revenue prediction. Unlike linear regression, which struggles with predicting the movie industry's high variance and outlier-dominated revenue patterns, this approach leverages multiple dense layers with ReLU (Rectified Linear Unit) activations to better model varying feature interactions - such as how a high-budget action film in English may perform much better than a low-budget art house film. The model incorporates regularization through dropout and L2 norms to prevent overfitting while maintaining the ability to generalize. By predicting log-transformed revenue values, it better handles the extreme dollar ranges typically seen in box office results. Performance metrics show steady decreases in both training and validation loss, with early stopping ensuring efficient convergence. However, some limitations still remain; the model still struggles with extreme outliers, which often depend on external factors like viral marketing or cultural trends that we can’t easily capture in our feature set. The MAE in log space translates to interpretable dollar-range predictions, though our confidence intervals could be further refined to give a more reliable estimate. Future improvements could incorporate additional features like marketing spend or web scraping tools, and potentially hybrid modeling approaches to better capture categorical data nuances. While this neural network outperforms linear regression through its ability to better capture non-linear relationships, there remains room to enhance its accuracy for outlier cases either through more sophisticated neural net architectures or through more enriched efforts toward feature engineering.
If the following embed does not show an image, please click here.
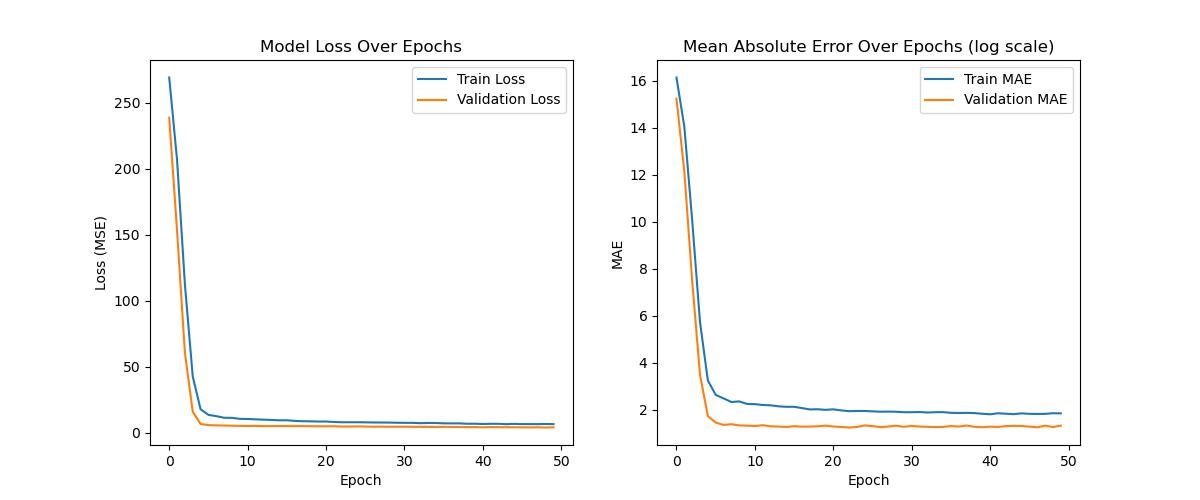
The training and validation loss curves (using MSE criterion) show steady convergence, with both metrics decreasing sharply in early epochs before plateauing, indicating effective learning without too severe overfitting. The close alignment between training and validation loss suggests seemingly proper regularization (which was done with dropout and an L2 norm) and sufficient data. However, the final plateau implies diminishing returns beyond a certain epoch count, meaning 30-50 epochs is all that's needed.
Residual error reflects inherent limitations in predicting extreme outliers (e.g., viral hits or flops), likely due to unmeasured factors like marketing or cultural timing.
4.4: Next Steps
Our results, while moderately successful, demonstrated potential for future improvement. Our recent tests suggest that XGBoost ensembles may outperform some of our current models, as they handle high revenue variance better and more accurately fit outliers. We could also enrich our original feature set with features like YouTube trailer views, likes, and critic ratings. These features may even improve upon our original linear model, leading to a greater R2 value. We would also incorporate temporal features, such as the movie’s release date and the time between the first announcement and the actual premiere. Lastly, we will apply rigorous data preprocessing and feature engineering methods to ensure variables are on comparable scales. In our implementation of these next steps, we aim to further increase the predictive accuracy of our model to the level of highly practical predictions.
References
-
Quader, N., et al. “A Machine Learning Approach to Predict Movie Box-Office Success.” IEEE Xplore, 1 Dec. 2017, ieeexplore.ieee.org/document/8281839 .
- him, Steve, and Mohammad Pourhomayoun. Predicting Movie Market Revenue Using Social Media Data. 1 Aug. 2017, pp. 478–484, ieeexplore.ieee.org/abstract/document/8102973 , https://doi.org/10.1109/iri.2017.68 . Accessed 21 Feb. 2025.
- Ahmad, Ibrahim Said, et al. “Movie Revenue Prediction Based on Purchase Intention Mining Using YouTube Trailer Reviews.” Information Processing & Management, vol. 57, no. 5, 1 Sept. 2020, p. 102278, www.sciencedirect.com/science/article/abs/pii/S0306457319309501 , https://doi.org/10.1016/j.ipm.2020.102278
- Rounak Banik. The Movies Dataset. Kaggle. https://www.kaggle.com/datasets/rounakbanik/the-movies-dataset
Proposal Contributions
| Dylan Bruce | Timotheus James | Vikrant Talwar | Alexander Thorne | Tyler Morgan |
| Created website final report page, created Neural Network Model, calculated NN model statistics & matplotlib visualizations, wrote NN model report sections, updated past report sections, created majority of presentation slides | Implemented random forest model and visual layout of the actual vs. predicted results | Proofread analysis, provided goals for improvement in future, and wrote Readme.md | Extensive proofreading, fact checking, some presentation slides, additional data scraping | Dataset exploration, feature engineering, final report and presentation |